Bar chart writing skills
Summary
paraphrase the question (introduction)
make a general comparison (overview)
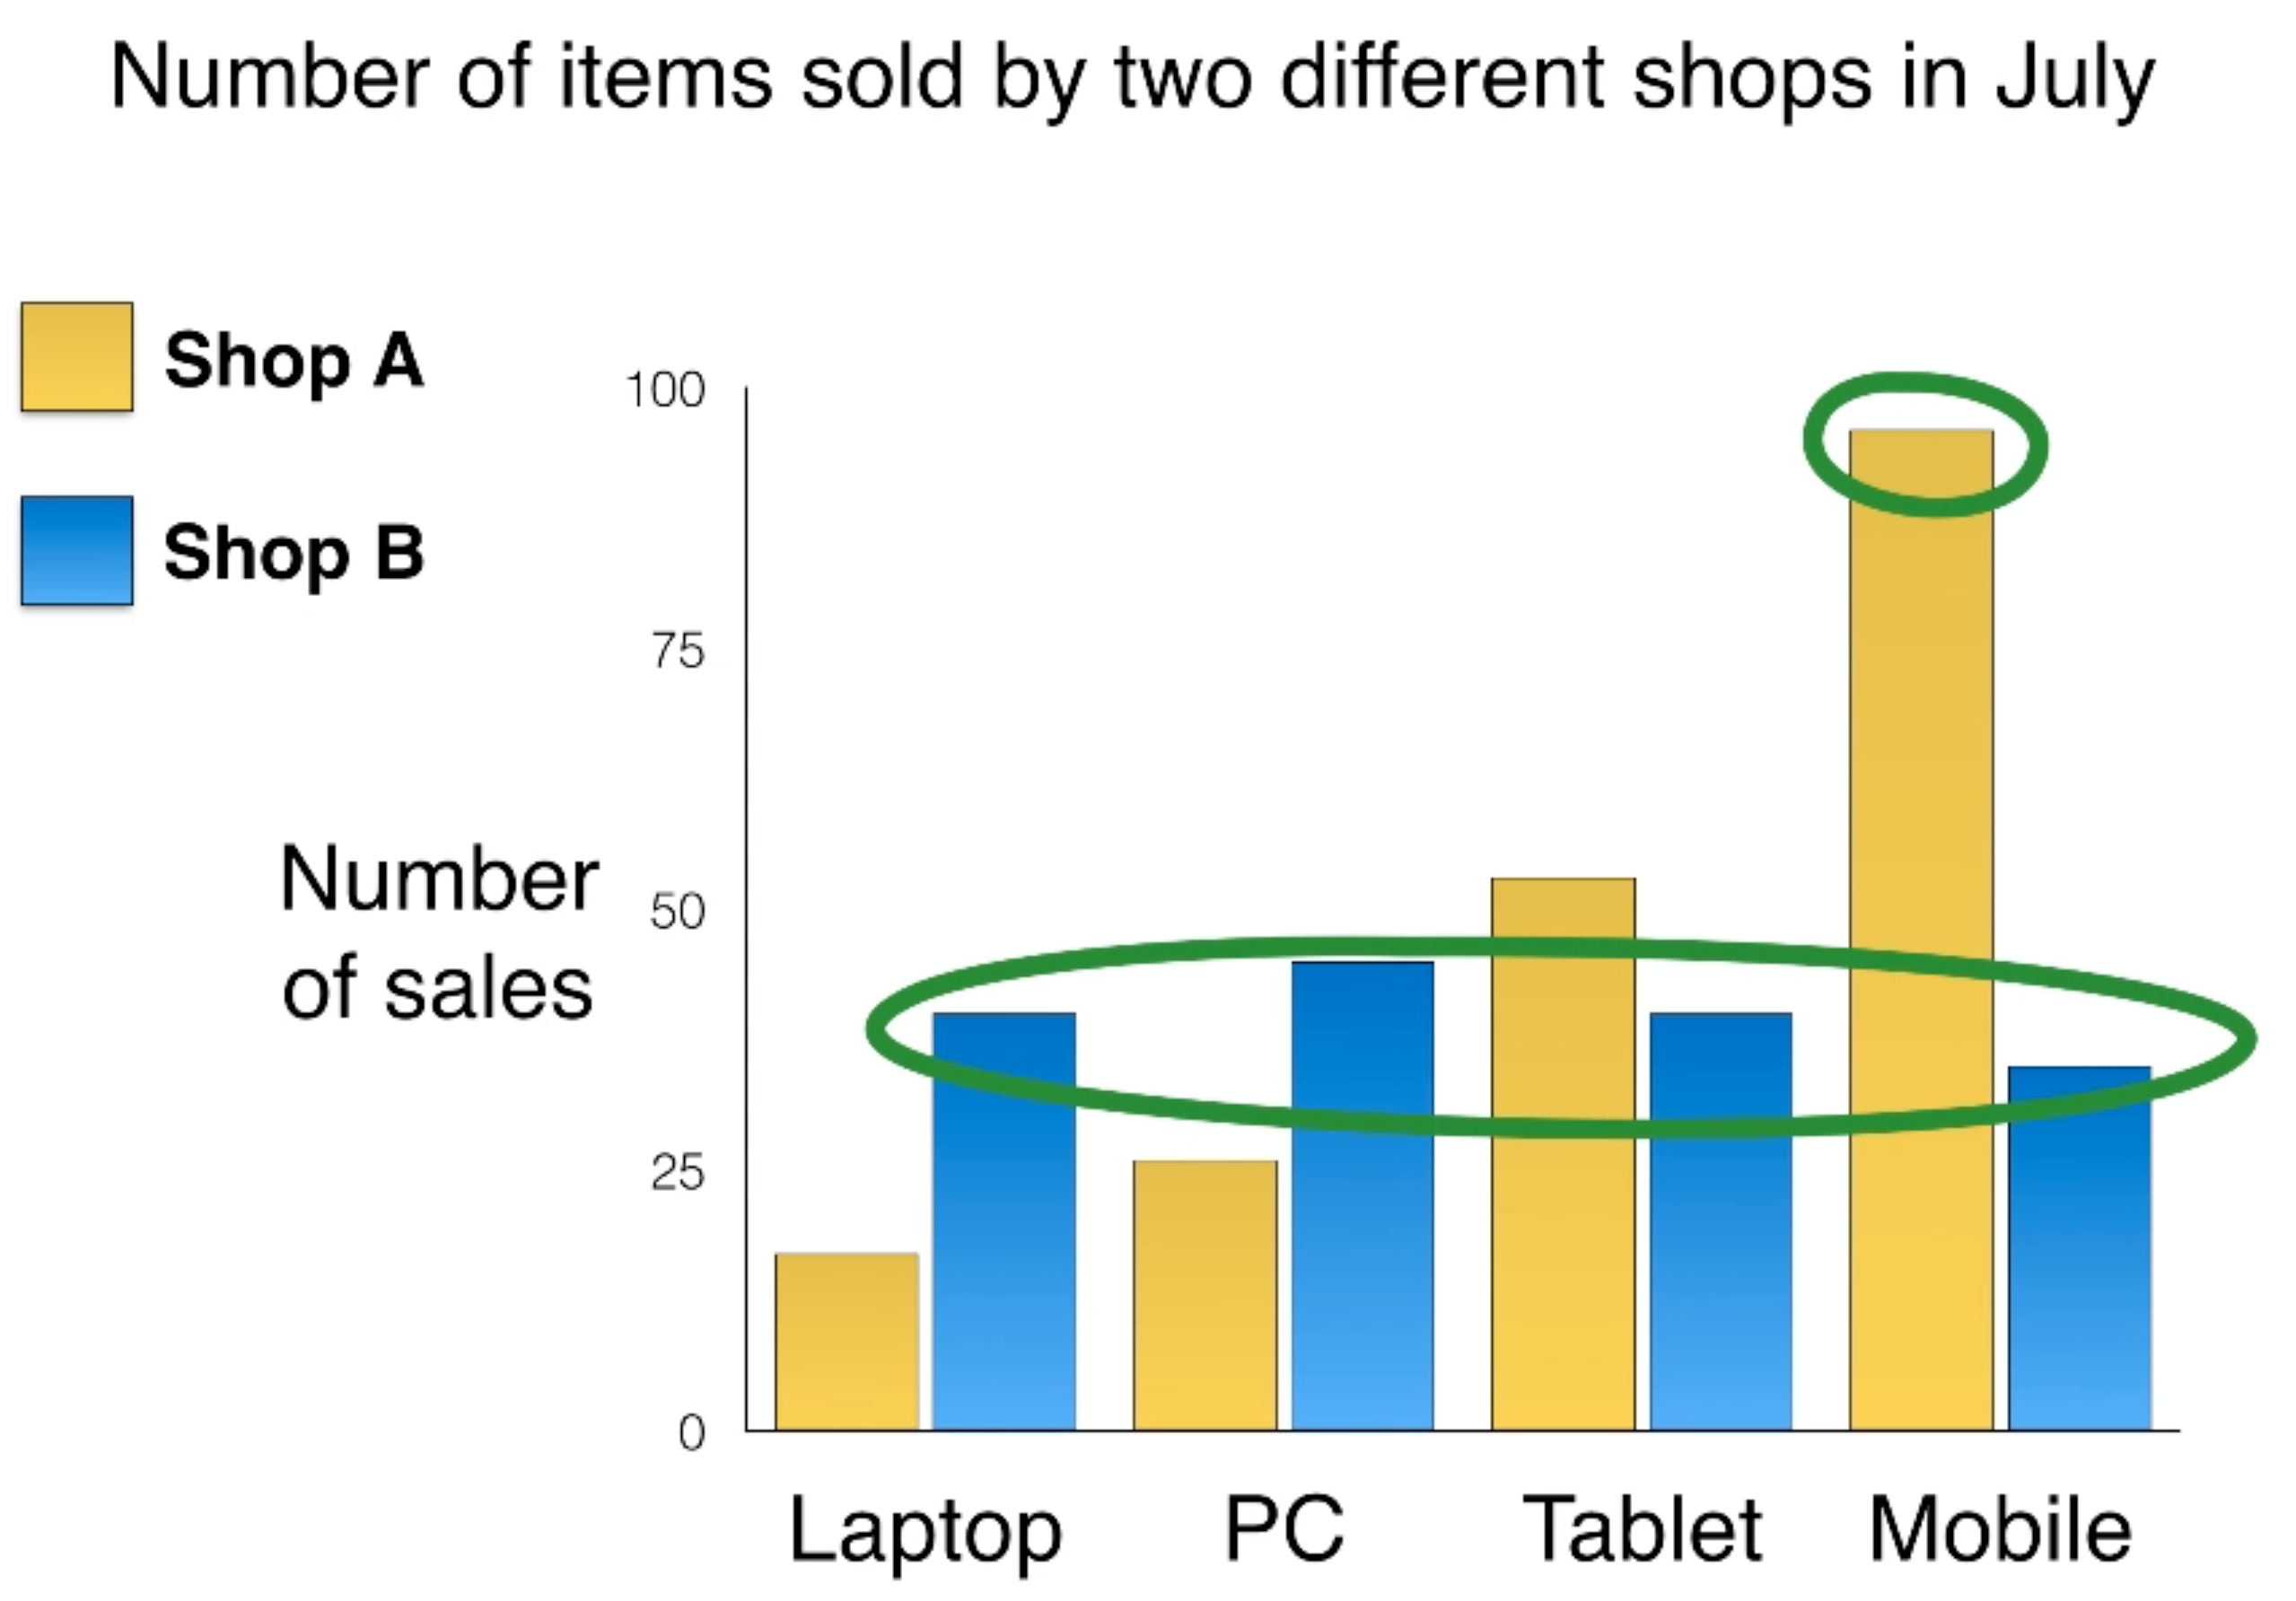
the green part
Compare specific numbers (details)
lot of comparisons by showing numbers
Example
Introduction:
Question:
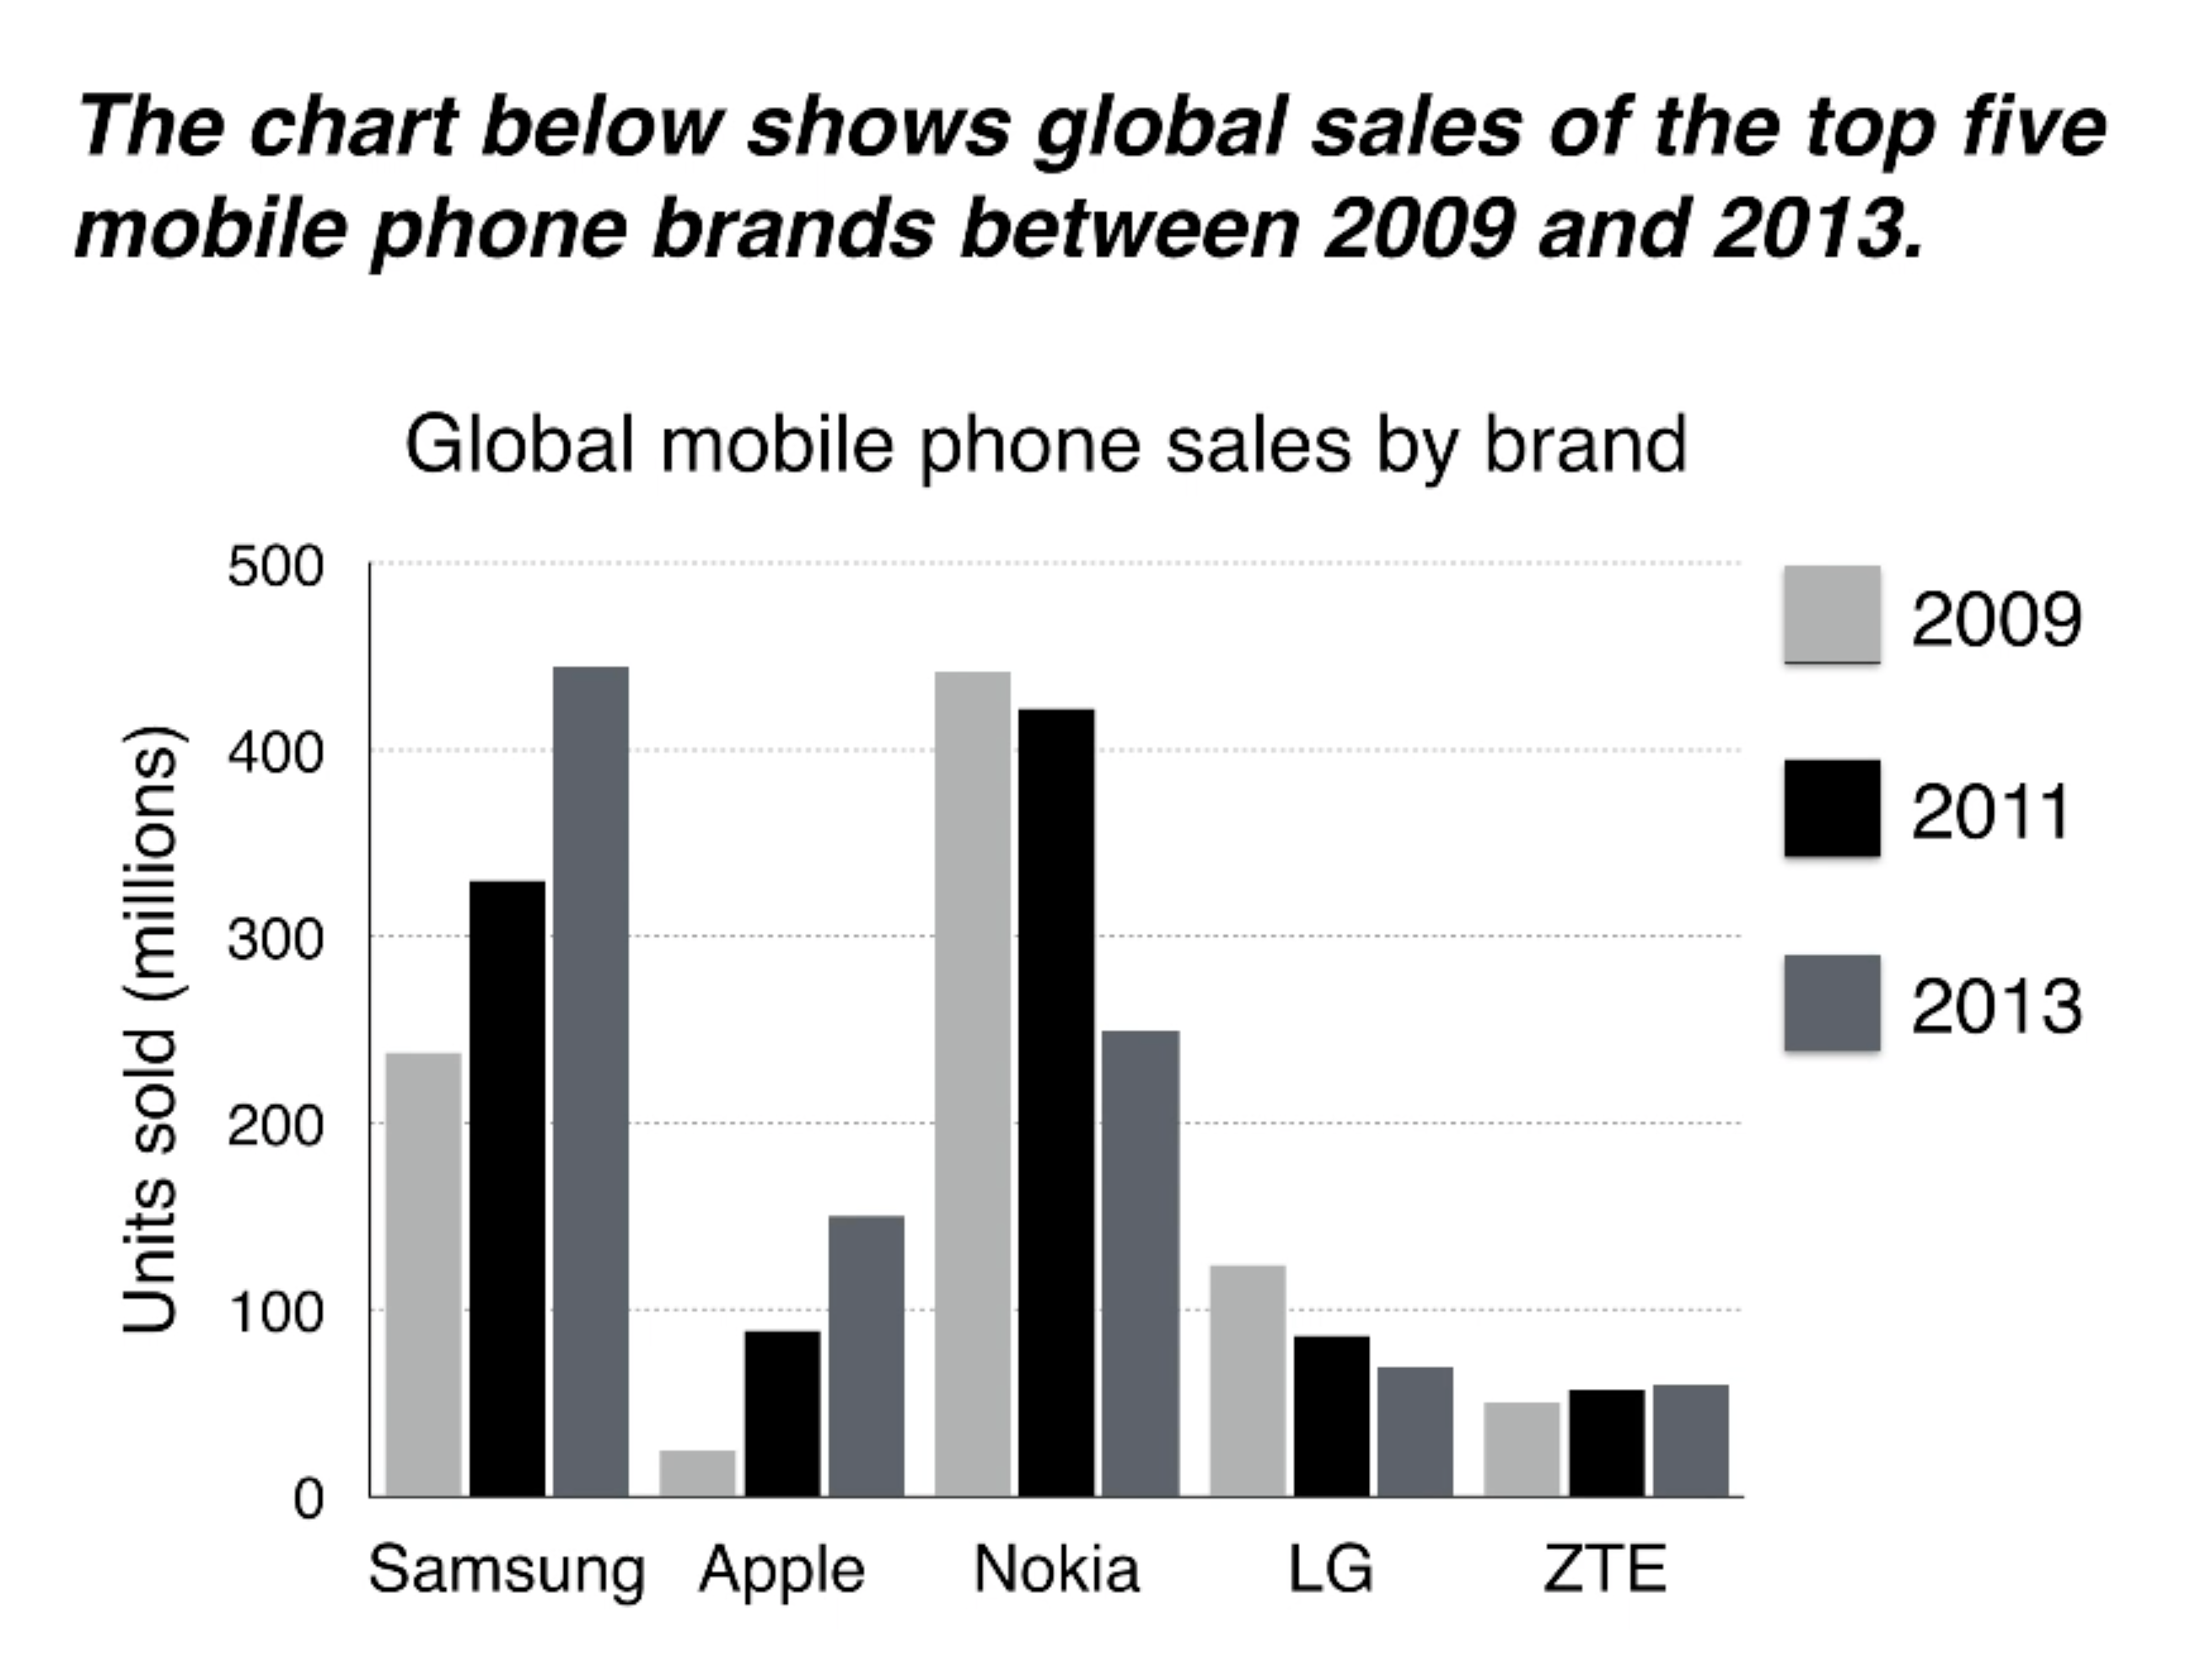
The chart below shows global sales of the top five mobile phone brands between 2009 and 2013.
Practice:
The bar chart compares global mobile phone sales using 5 popular brands over a period of 4 years.
Template:
The bar chart compares the number of mobile phone sold worldwide by the five most popular manufacturers in the years 2009, 2011 and 2013.
Overview: 2 sentences, 2 main points
Practice:
In 2009 and 2011, the sales of mobile phones made by Nokia were significantly greater than other brands. However, Samsung became the most popular mobile phone brand in the world in 2013.
Template:
It is clear that Nokia sold the most mobile phones between 2009 and 2011, but Samsung became the best selling brand in 2013. Samsung and Apple saw the biggest rises in sales over the 5-year period.
Details in P3:
Practice:
In 2009, Nokia sold nearly 450 mobile phones, which was almost double the number of handset sales of Samsung, which was the second manufacturer at that time. But after 4 years, Nokia fell nearly 200 units sold which was also the number of Samsung’s increasing sold. By 2013, mobile pyhone sales of Samsung had reached 450 million units and became the market leader.
Template:
In 2009, Nokia sold close to 450 million mobile phones, which was almost double the number of handsets sold by the second most successful manufacturer, Samsung. Over the following four years, however, Nokia’s sales figures fell by approximately 200 million units, whereas Samsung saw sales rise by a similar amount. By 2013, Samsung had became the marker leader with sales reaching 450 million units.
Review:
In 2009, Nokia sold close to 450 million mobile phones, which was almost double the number of handsets sold by the second successful manufacturer, Samsung. Over the following four years, however, Nokia’s sales figures fell by approximately 200 million units, whereas Samsung saw sales rise by a similar amount. By 2013, Samsung had became the market leader with sales reaching 450 million units.
Details in P4:
Template:
The other three top selling mobile phone brands between 2009 and 2013 were LG, ZTE and Apple. In 2009, these companies sold around 125 million, 50 million and 25 million mobile handsets respectively, but Apple overtook the other two vendors in 2011. In 2013, purchases of Apple handsets reached 150 million units, while LG saw declining sales and the figures for ZTE rose only slightly.
Review:
The other three top selling mobile phone brands between 2009 and 2013 were LG, ZTE and Apple. In 2009, these companies sold around 150 million, 50 million and 20 million mobile handsets respectively, but Apple overtook the other two vendors in 2011. In 2013, purchases of Apple handsets reached 150 million units, while LG saw declining sales and the figures for ZTE rose only slightly.
Vocabulary
- sold worldwide
- sales figures, purchases
- Most popular, best selling brand, top selling
- second most succesful manufacturer
- Market leader
- mobile phones, handsets, units
- brands, manufacturer, vendor, company
- saw the biggest rises, saw declining sales
- close to, almost, approximately, around
- double the number of
- rise by a similar amount
- respectively
- Overtook the other two vendors